If you’ve ever tried to read a comprehensive evaluation, looked at all the norm referenced tests and thought, “Great, now I need a math degree just to read this report,” you are not alone.
What are norm referenced tests?
Schools and clinicians need a way to compare a student’s performance to a larger group of individuals. That’s what norm referenced tests are designed to do. They take a skill and they compare your child’s score to a representative sample of other children the same age.
Think of it like this: if your child is 13, the test compares your 13-year-old to lots of other 13-year-olds who took that same test under the same rules. That comparison group is the “norm group,” and the score tells you where your child falls relative to that group. This is different from a criterion-referenced test which asks, “Did you master a specific skill?” You really don’t need to know this but in case you’re ever on Jeopardy.
They’re popular in comprehensive evaluations because they give us a common language. If I tell you a standard score of 100 is average, and 85 is below average, you can start to map out a pattern, all without being a statistician.
What the scores mean
When an evaluator assesses a condition, they are usually looking for a specific profile. Norm referenced tests help demonstrate that a child’s results are significantly below what is expected for their age. I already talked about the different tests in a previous post.
So let’s decode the vocabulary. Most norm referenced tests report some combination of:
- Percentile ranks (the percentage of same-age peers your child scored at or below)
- Standard scores (often average = 100, with a typical range roughly 85–115)
- Scaled scores (often average = 10, used for subtests)
- Confidence intervals (a range that acknowledges scores are estimates)
- Age/grade equivalents (often misunderstood)
Percentiles
If your child is in the 25th percentile, it does not mean they got 25% correct. It means they performed as well as or better than 25% of the kids in the entire group of kids who took the test (the norm referenced group). Said a difference way they scored below 75% of the kids taking the evaluation. Let’s dig into this. Percentile is a relative position or rank. So a 70th percentile means a position in which 70% of the values fall below.
- 50th percentile = right in the middle (average)
- 25th percentile = below average (but not necessarily “severe”)
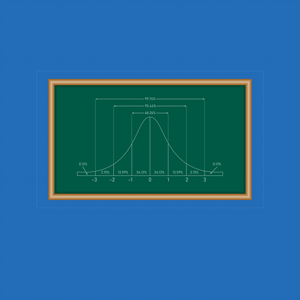
- 16th percentile = about 1 standard deviation below the mean (often considered clearly below average)
- 9th percentile and below = significantly low (often where you see strong concern flags)
I recognize that seeing a low percentile can feel like a punch in the stomach. It’s helpful to think of this as a snapshot of a skill on a particular day, under particular conditions. This brings us to the next concept that you need to understand. Standard deviation. This measures the range of the data points. Are they all clustered together or are they spread over a wider area. Standard deviation tells us where the results fall. For example 1 standard deviation below and above the average captures 68% of all the results. Two standard deviations capture 95% of the people. Basically, standard deviation allows us to compare individuals.
Common Scores
Different tests use different score scales, and standard deviation lets us make comparisons. On many reports you will see standard scores and scaled scores so let’s talk about what these mean.
Standard scores are designed so that 100 is average. 50% of the kids are above and 50% are below. Many clinicians look at 85 as the lower edge of the “average range,” and 115 as the edge of the above average range.
Standard Scores
therefore
- 1 Standard deviation (SD) below = 85
- 2 Standard deviations (SD) below = 70
- 1 Standard deviations (SD) above = 115
- 2 Standard deviations (SD) above = 130
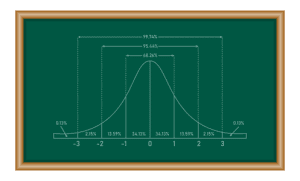
Another way to think of this is 68% of the scores will fall between 85 and 115, while 95% of the results will fall between 70 and 130. Why dis this important? Remember, we are comparing your child to other children in their same age group who took the test. This comparison gives us perspective. Now let’s discuss the subtests. Many of them are reported using scaled scores. This is because subtests measure more specific skills.
Scaled Scores (subtests)
therefore
- 1 SD below = 7
- 2 SD below = 4
- 1 SD above = 13
- 2 SD above = 16
Using the same logic, 68% of results will fall between 7 and 13 and 95% of results will fall between 4 and 16. So, the scaled scores tell us how a child did on a specific subtest while standard scores tell us how a child did over a broad range.
Confidence intervals
Now your child took this test on a specific day under certain conditions. Good tests admit uncertainty. A confidence interval is the test’s way of acknowledging that if they tested your child multiple times, the true score would likely fall in this range. This is important because kids are human. They get tired. They get anxious. They get distracted.
Grade equivalents
Grade equivalents sound simple. Your child reads like a 4.2, but this can be misleading.
They don’t mean your child can do fourth-grade work in all reading contexts. It means their score matched the average score of students in that grade on that specific test. It’s easy to over-interpret, so treat grade equivalents as background noise, not the headline.
As you read the reports, it is completely appropriate to ask questions about a score and have it explained in everyday terms. A good evaluator will slow down, translate, and check that you understand what they are saying. You’re not being difficult, you are ensuring that you understand what they are saying.
Norm Referenced Tests Summary
Let’s summarize what norm referenced tests are genuinely helpful for:
- Documenting that a skill is significantly below age expectations
- Identifying a profile or pattern of strengths and weaknesses
Norm referenced tests help rule out explanations. For example, strong reasoning skills alongside weak decoding suggests that the problem is not related to intelligence, rather there is a need for a structured literacy instruction.
Now, let’s flip the coin and discuss the limitations:
- A norm-referenced score does not automatically equal a diagnosis.
- A single low score does not tell you why the skill is low.
- Average scores can hide real struggle, especially if your child compensates with intelligence or context clues.
Sometimes a child can score in the low average range, and the school says they are not concerned. A score may technically not be low enough yet still represent a real problem that deserves support. That’s where you need to document what you see and share your concerns. Does homework take three hours? Is reading exhausting? Does your child avoid anything with print.
In other words: norm referenced tests can help you move from thinking something is off to identifying the specific skill set that needs support. That’s powerful because targeted support is what changes the trajectory. Scores don’t automatically translate into an action plan. Someone has to translate them into next steps. When we pair the right instruction and support, kids change. Confidence changes. Home life changes.